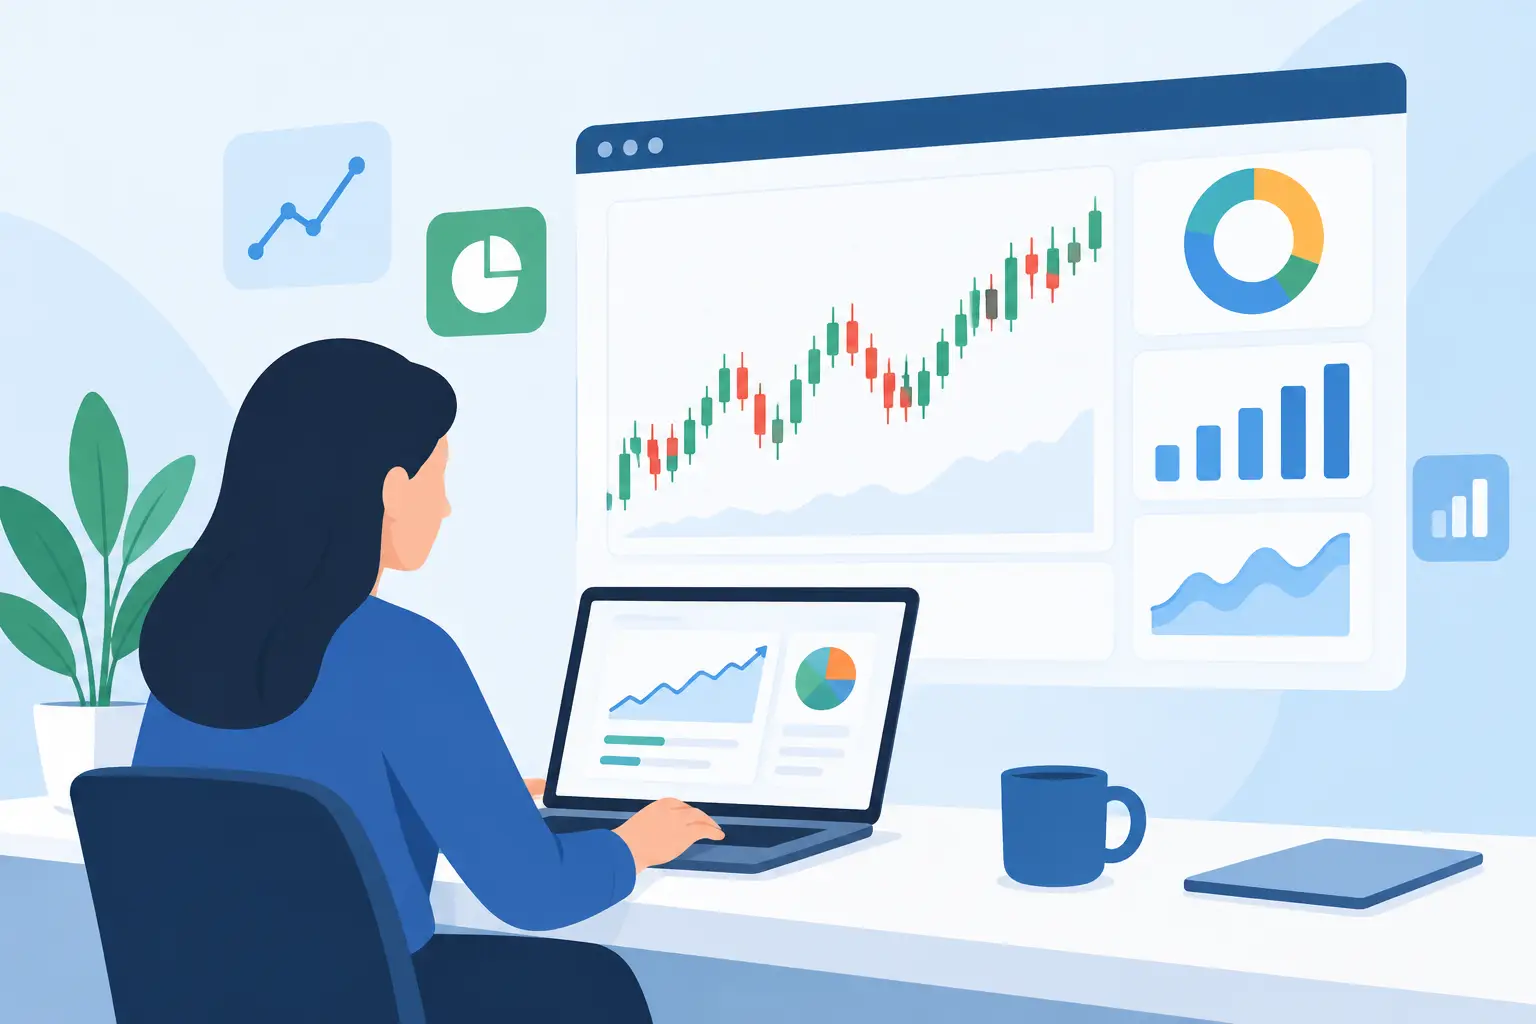
A free charting platform is often where a trader’s process either becomes more disciplined or remains a collection of opinions. Charts are not valuable because they display price. They are valuable when they help you define context, identify a setup, manage risk, and make the same decision under the same conditions. For active traders, the question is not whether a platform is free. The question is whether it gives you enough structure to build repeatable execution.
A free platform can be an effective starting point for stocks, futures, Forex, commodities, and crypto. It can also become a distraction if it encourages endless indicator testing, visual clutter, and reactive decision-making. Serious traders should evaluate charting tools by their ability to support rules-based systems, not by the number of default studies on the screen.
What a Free Charting Platform Must Do
The minimum standard is clear, reliable price visualization across the instruments and timeframes you trade. A day trader may need intraday charts that update efficiently during active market hours. A swing trader may need clean daily and weekly views, along with enough historical data to study prior market behavior. A futures trader may also need contract-specific context and a practical way to monitor correlated markets.
That baseline matters, but it is only the beginning. A capable charting environment should make it easy to organize a workspace around your actual trade process. You should be able to save layouts, compare timeframes, mark levels, and apply a consistent set of studies without rebuilding the chart every session.
Consistency is a performance feature. If your charts look different every morning, your analysis will tend to change with them.
Price Action Needs Context
Candles, bars, and moving averages can describe price action, but they do not automatically explain participation or market condition. Traders who rely only on a familiar pattern may miss whether a move is supported by volume, volatility expansion, market breadth, or a broader trend condition.
A useful platform lets you add context without burying the chart. The goal is not to stack indicators until one agrees with your opinion. The goal is to select a small number of inputs that answer specific questions:
- Is the market trending, rotating, or compressing?
- Is participation confirming the move?
- Is volatility expanding enough to justify the trade’s risk?
- Is price approaching a level where the setup is no longer valid?
Those questions turn chart reading into a defined decision process. They also expose when a trader does not have a process yet.
Choose Tools That Support Rules, Not Stories
The biggest weakness of many free charting tools is not a missing feature. It is the temptation they create to interpret every move differently. A platform with dozens of indicators can still produce inconsistent results when the trader has no fixed criteria for using them.
Before adding a study, define its job. A trend measure might determine trade direction. A volume-based tool might confirm participation. A volatility measure might set stop distance or tell you when to reduce size. Market internals may help index and equity traders assess whether broad participation supports an intraday move.
Each tool should have an observable condition and a defined response. For example, “I enter when price is above a trend filter” is incomplete. A usable rule specifies the timeframe, trigger, confirmation, entry location, stop logic, and conditions that invalidate the setup. The charting platform should make these elements visible quickly enough to use in real time.
This is where a free product can prove its value. If it helps you test whether your rules are clear, it is doing meaningful work. If it only gives you more ways to rationalize a trade, it is adding noise.
Evaluate Data, Timeframes, and Market Coverage
Not every trader needs the same data. Equity traders may prioritize premarket and after-hours visibility, broad market internals, and sector comparison. Futures traders may care more about session structure, volume behavior, and the relationship between related contracts. Forex and crypto traders may need continuous market coverage and flexible session settings.
Check whether the platform covers the symbols you actually trade and whether the available data is sufficient for your holding period. Delayed data may be acceptable for end-of-day research but can be a serious limitation for an active intraday strategy. Limited historical data can also make it difficult to review a setup across different market regimes.
Timeframe flexibility matters for the same reason. A setup that appears clean on a five-minute chart may be directly beneath a major daily resistance level. A free platform should allow you to move between execution and higher-timeframe context without turning the workflow into a manual exercise.
There is no universal ideal chart interval. The right timeframe is the one that matches your strategy’s holding period and gives your rules enough information to operate. What matters is that you use it consistently.
Indicators Should Improve Signal Quality
A charting platform is not a trading system simply because it includes indicators. The advantage comes from combining indicators into a framework that can be measured and followed.
For instance, volume analysis can help distinguish a quiet pullback from a high-participation reversal. Volatility tools can help determine whether a tight stop is realistic or whether the market’s current range makes the trade inefficient. Seasonality may offer useful background probabilities, but it should not override current price behavior and risk conditions.
The trade-off is simplicity versus detail. Too little information can leave you blind to important conditions. Too much information slows decisions and creates conflicts between signals. Most active traders benefit from a clean chart with a limited number of purpose-built tools rather than a dashboard filled with unrelated studies.
If a signal cannot be explained in one or two direct sentences, it will be difficult to execute with consistency. That does not mean every strategy must be simple. It means the decision rules must be clear enough to survive a fast market and a losing streak.
Use the Free Version to Build a Better Process
A free charting platform is most useful when treated as a proving ground. Start with one market, one setup, and one repeatable chart layout. Track what the setup looks like before entry, where it fails, and how it behaves under different volatility conditions.
Do not judge the platform after one winning or losing trade. Judge it after it has supported a meaningful sample of planned decisions. Can you find your levels quickly? Can you see the conditions your strategy requires? Can you review prior examples without guessing why you entered? Can you maintain the same workflow when markets become fast?
These are practical questions because execution quality often breaks down before analysis does. A trader may recognize a valid setup but still enter late, oversize the position, or ignore the stop because the plan was not visible and defined before the market moved.
TickSurfers encourages traders to try our free charting platform as a structured environment for building that discipline, then add specialized tools only when they serve a documented trading need. Precision comes from a process you can repeat, not from a crowded screen.
Know When Free Is Enough
For a new or developing trader, free charting can be enough to establish the fundamentals: market structure, level selection, multi-timeframe analysis, risk planning, and trade review. It may remain enough for a trader whose strategy uses straightforward price and volume rules.
The limitations become more relevant when your process depends on specialized indicators, advanced alerts, automation, deeper volume analysis, customized scans, or more detailed historical testing. At that point, the decision to upgrade should follow a demonstrated need. Paying for features before you have rules is rarely productive. Refusing useful tools after you have defined a measurable edge can be equally limiting.
A professional approach is to let the strategy dictate the toolset. If an added feature saves time, improves consistency, or gives objective confirmation that your current process lacks, it may justify its cost. If it merely makes the chart more interesting, it probably does not.
The chart should never be the source of conviction by itself. Build rules that define what you will trade, what you will avoid, and how much you will risk. Then choose the platform that helps you follow those rules when it matters most.