What is TickSurfers?
TickSurfers is a subscription-based, web-based charting platform for equities, futures, options, FX, and crypto.
Read the full answer →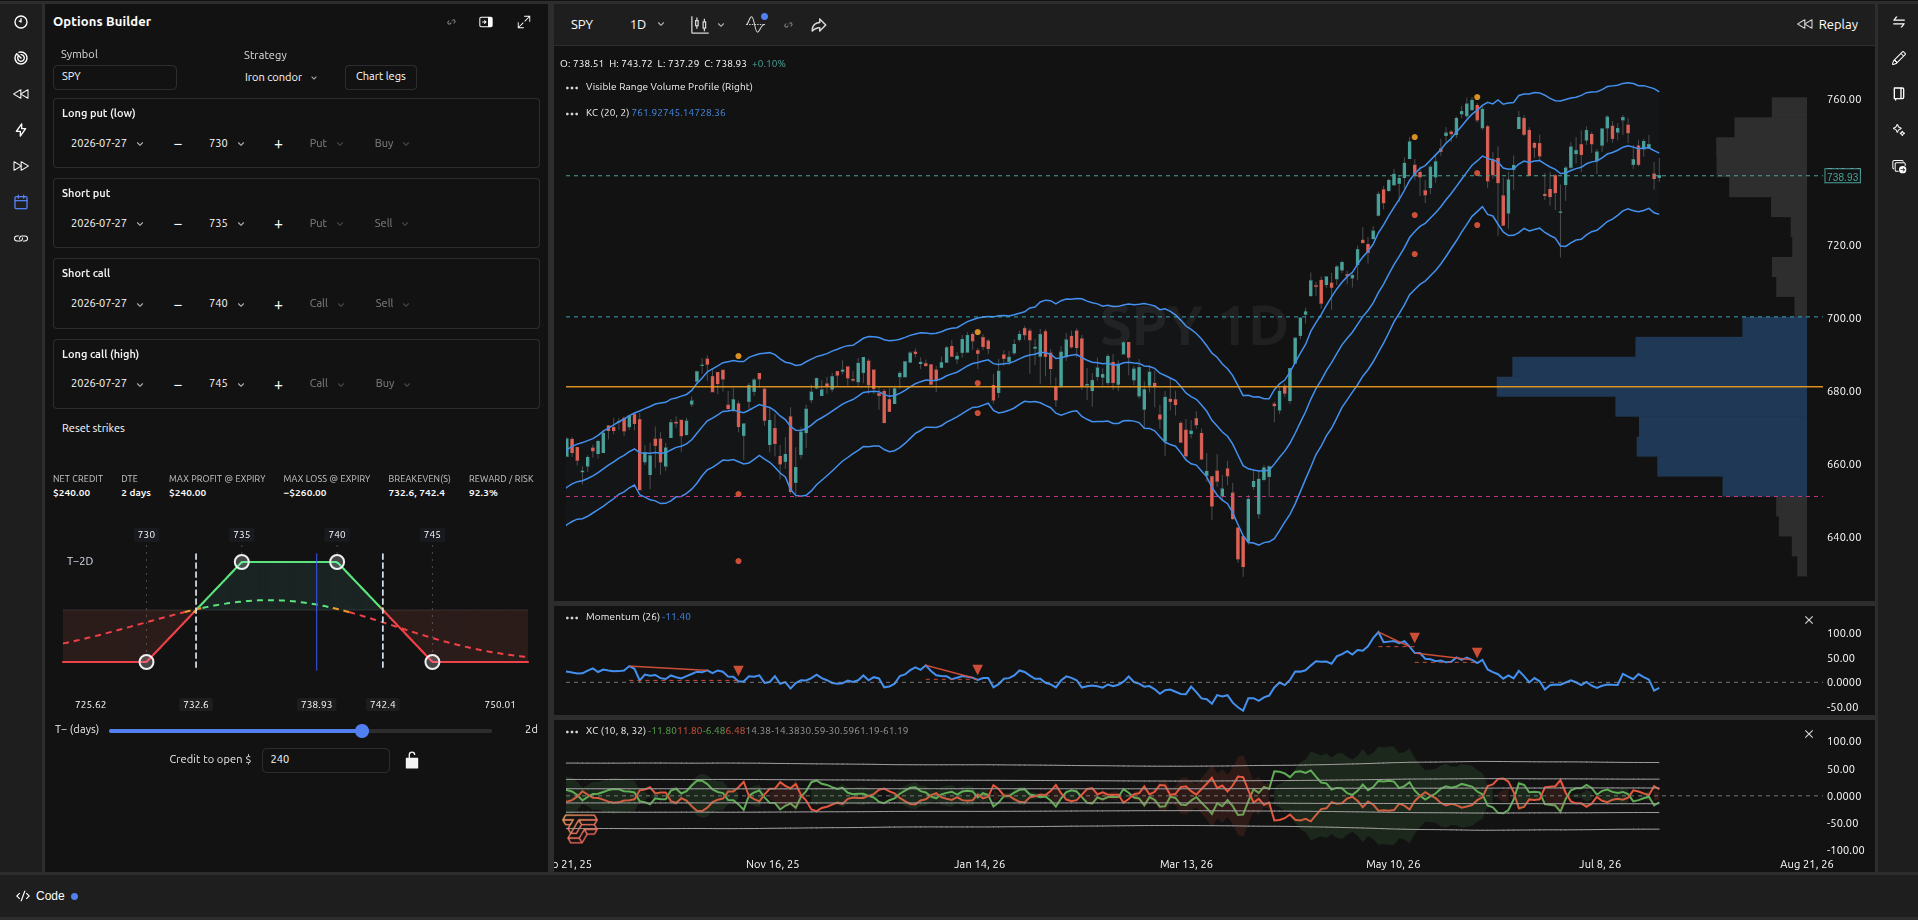
TickSurfers Chart
Backtest, walk-forward, options, and custom studies — the tools traders use to find an edge, in one web chart.
A free account is required to open the chart. Create one to use the chart before you buy Pro.
 and

The short answer
TickSurfers is a web-based charting platform for traders who want to test an idea, not just look at a chart. Chart equities, futures, options, FX, and crypto in your browser, write an indicator or strategy in plain JavaScript, then backtest and walk-forward test it before you risk capital.
Nothing to install. A free account opens the chart. Pro adds the research tools: backtesting, parameter optimization, walk-forward analysis, the options chain and builder, and private studies.
Built for futures and options traders, systems traders, and developers who want a measurable edge.
Create free account or compare plansNo data subscription and no desktop install. Start with a free account, then add the research tools when you are ready.
Sign up, open the chart in your browser, and pick a symbol. Nothing to install and no data setup.
Start from a built-in indicator, or write an indicator or strategy in pure JavaScript in the in-chart editor.
On Pro, backtest the idea, grid-search the inputs, then walk-forward test it to see whether the edge holds out of sample.
A full charting workbench: live data, scriptable indicators and strategies, statistical validation, and options analysis.
Run any built-in or custom strategy across full bar history. Get a complete trade log, equity curve, win rate, drawdown, profit factor, and per-trade option markers on the chart.
Grid-search any combination of strategy inputs, symbols, and timeframes. Rank by built-in metrics or write your own fitness script in JavaScript.
Roll in-sample optimization and out-of-sample validation across the bar history to confirm parameter stability — not just curve-fit numbers on a single window.
Open one, two, or a grid of charts side-by-side. Link backtest, optimization, walk-forward, and options panels to specific panes via colored slot binding.
Browse full chains with Greeks, IV, and last/volume columns. Build long calls, spreads, condors, custom multi-leg strategies, and visualize P/L with breakeven markers on the chart.
See the options builder →Write indicators, strategies, and optimization fitness scripts in pure JavaScript — no proprietary language to learn. Optional WASM/WAT for performance-critical studies. In-chart editor, TA helpers, and drawing primitives included.
Multiple watchlists, custom number/string/formula columns, price alerts (above, below, cross), per-row strategy scans, and one-click self-optimization per symbol.
Trendlines, horizontal/vertical lines, rectangles, circles, triangles, text. Bar-replay scrub with autoplay to study setups bar-by-bar.
Log every trade — equity, futures, multi-leg options — with entry/exit, stops, profit targets, notes. Auto-computed win rate, win/loss ratio, biggest winner/loser, streaks.
TickSurfers ships with the studies futures traders, systems traders, and professional analysts actually use — plus exclusive series you will not find anywhere else.
Official rules-based indicators from a 50+ year veteran trader: Moving Average Channel, 8 Open Close, Divergence Triggers (Momentum, MACD, CCI, DPO), and the Daily Sentiment Index.
Explore Jake Bernstein indicators →The Futures Premium / Backwardation indicator recommended by Larry Williams. Aligns directly with the contextual trading methods he teaches.
View backwardation →Tools used by prop desks like SMB Capital: ADD ratio, Cumulative TICK, VOLD ratio, RVOL, AVOL, and Volume Z-Score.
Browse market internals →A unique seasonality indicator that highlights bullish and bearish windows up to a year forward — for futures, commodities, equities, and crypto.
View seasonality →Brian Latta's concurrent, dual-perspective system built on Jake Bernstein's methods — 30+ tradable conditions in one indicator.
View Expansion Contraction →Browse the entire library — momentum, breadth, internals, volume, futures, divergence triggers, and Jake Bernstein systems.
All indicators →Stop tuning a strategy by hand for every market. One click runs a bounded grid-search on recent history, stores the best parameters per symbol, and re-optimizes on your schedule — across the chart, the watchlist, and every backtest you fire afterwards.
Self-optimize the active chart's strategy with a single toolbar action. Best parameters apply immediately and persist with the workspace.
Run the same self-opt across an entire watchlist. Each symbol gets its own best parameter set — no manual tuning row-by-row.
Optimal inputs are stored per symbol and reused on every backtest, scan, and chart load until you re-optimize.
Configurable on-trade re-optimization keeps parameters fresh as market regime shifts — without rewriting the strategy.
Create a free account to use the chart before you buy Pro. Pro ($30/mo or $300/yr; you save $60 on the annual plan) adds backtesting, walk-forward analysis, options research, and private studies. Jake Bernstein indicators are a $750 one-time add-on and require Pro.
Short answers to the questions that decide whether TickSurfers is right for you. Each one links to the full explanation.
TickSurfers is a subscription-based, web-based charting platform for equities, futures, options, FX, and crypto.
Read the full answer →A free account is required to open the chart. Pro ($30/month or $300/year; you save $60 on the annual plan) adds backtesting, walk-forward analysis, options tools, and private indicators.
Read the full answer →Yes. TickSurfers Chart is web-based — it runs on desktop and mobile with no desktop install required.
Read the full answer →Pro includes strategy backtest, parameter optimization, and walk-forward analysis on one shared runner.
Read the full answer →A free account includes pure JavaScript coding, including optional WASM/WAT. Private and shared indicators are Pro-only.
Read the full answer →Yes. Create a free account to use the chart before you buy Pro.
Read the full answer →
At TickSurfers, we are not just developers — we are active traders, offering the same tools we use to find high-probability trades. Need guidance on building a trading plan, mastering indicators, or trading options? Schedule a call with Brian Latta for expert support.
For mentorship from one of the industry's top Futures traders, explore the Jake Bernstein Mentorship Program for Futures Trading Education — a proven path to professional trading success.