Full List of Indicators and Features
Explore all the powerful trading tools and algorithms TickSurfers offers to enhance your trading experience. Find the full list of indicators, trading systems and other features below.

Expansion Contraction
Learn More View ChartThis one-of-a-kind indicator was created by Brian Latta and is based on Jake Bernstein’s trading systems. Expansion Contraction is the first concurrent and dual perspective system indicator with over 30 tradable conditions.

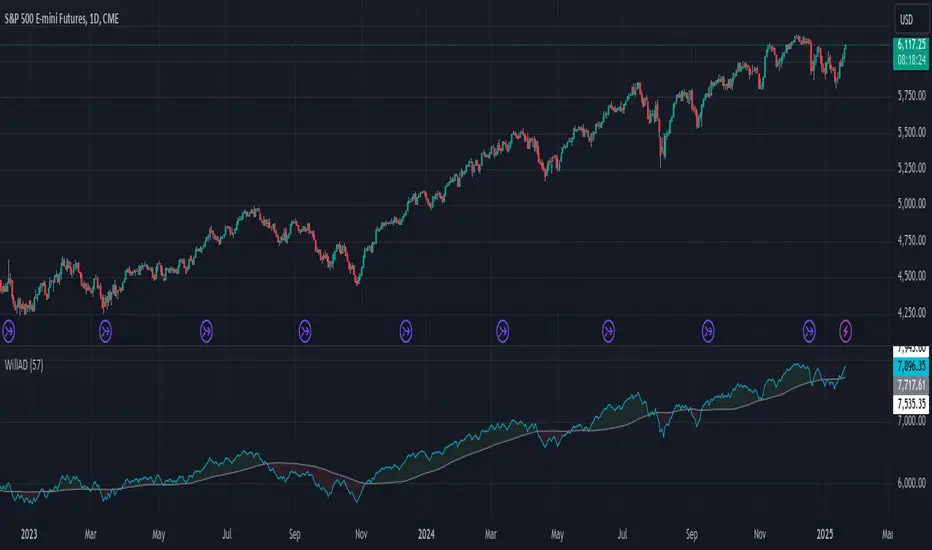
Williams Acc/Dist
Learn More View ChartLarry Williams’ accumulation and distribution formula with a simple moving average of WillAD, used by Jake Bernstein with a 57 period simple moving average. Use in combination with Jake’s trading systems to confirm trend direction.

Benner Cycle
Learn More View ChartVisualize Samuel Benner’s market cycles in TradingView. Set the chart to a 1-year timeframe with the SPX index and plot the Benner Cycle Indicator to see past, future and current cycle predictions.

ADD Ratio
Learn More View ChartGet raw ADD readings, ADD Ratio and ADD Breadth all in one indicator. This indicator is designed for day traders but can be used by anyone to gauge market internals.

Backwardation (Premium)
Learn More View ChartCalculate backwardation (or contract premium) readings for Futures and Commodities. When the backwardation reading crosses above zero it means the market is setup for a bullish move. Does not work in reverse. This reading works only for bullish readings.

COT Report
Learn More View ChartFollow the “big money” or “smart money” traders with this Commitment of Traders (COT) Report indicator. This indicator includes disaggregated data in addition to the legacy data for both TradingView and TradeStation.

Keltner Clouds
Learn More View ChartThis multi-talented indicator makes use of every plot line to provide you with useful information in a minimalistic approach. It provides 3 (adjustable) ATR bands of the Keltner Channel without cluttering the chart. In addition, it uses the middle band to provide you with various options for color-coded visual indicators.

Offense / Defense Line (OD Line)
Learn More View ChartA market breadth indicator that measures offensive ETF sectors versus defensive sectors. When the OD line increases it can be an indicator of market uncertainty. As it decreases it indicates a bullish market.

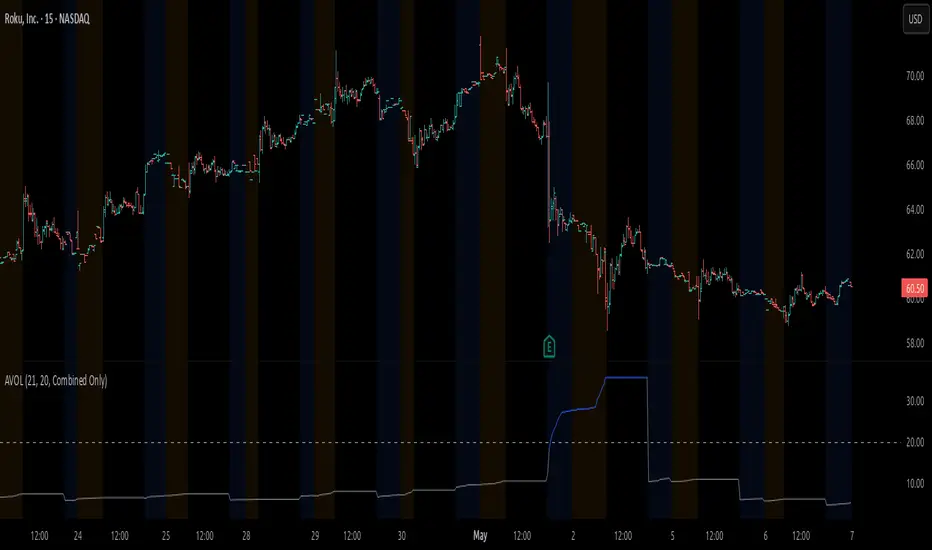
AVOL (Ext. Hours Average Volume)
Learn More View ChartA measurement of pre-market volume used to identify stocks in play that have a higher likelihood of follow through in momentum.

RVOL (Relative Volume)
Learn More View ChartRelative Volume or RVOL is a measurement of current volume to average volume at time. It’s typically miscalculated by comparing current volume against average volume (which is more accurately described as Volume Z-Score, also available by TickSurfers).

Seasonality
Learn More View ChartThis professionally-built seasonality indicator creates a calculation that plots one year into the future so you can spot upcoming seasonality trends in time. Tooltips are added to give you insights into the win rate, history and direction of seasonality.

Hedge Up
Learn More View ChartThis proprietary formula is akin to a fear gauge for the S&P 500 exclusively. Able to determine when volatility is expected to expand days (sometimes weeks) in advance.

Cumulative TICK
Learn More View ChartGet raw TICK readings or cumulative TICK calculation all in one indicator. An important gauge of market internals that can be used alongside ADD and VOLD readings.

TRIN (Arms Index)
Learn More View ChartA market breadth indicator developed by Richard W. Arms in 1967 to measure market strength. It is plotted as a ratio by dividing ADD ratio by VOLD ratio.

VIX Ratio
Learn More View ChartIn addition to providing a raw reading of the VIX, this indicator provides access to VIX ratio, a powerful formula that can spot bullish market reversals after a strong sell-off.

Volatility Cycle
Learn More View ChartThe volatility cycle indicator measures the strength of a trend, not the direction. Useful in spotting compression or expansion in prices.

VOLD Ratio
Learn More View ChartView raw VOLD readings or VOLD ratio. This market internal goes hand-in-hand with ADD and TICK indexes.

Volume Z-Score
Learn More View ChartVolume Z-Score (not to be confused with RVOL) compares current volume against average volume. This indicator provides insights into strong bullish volume or strong bearish volume to help spot significant volume in any direction.