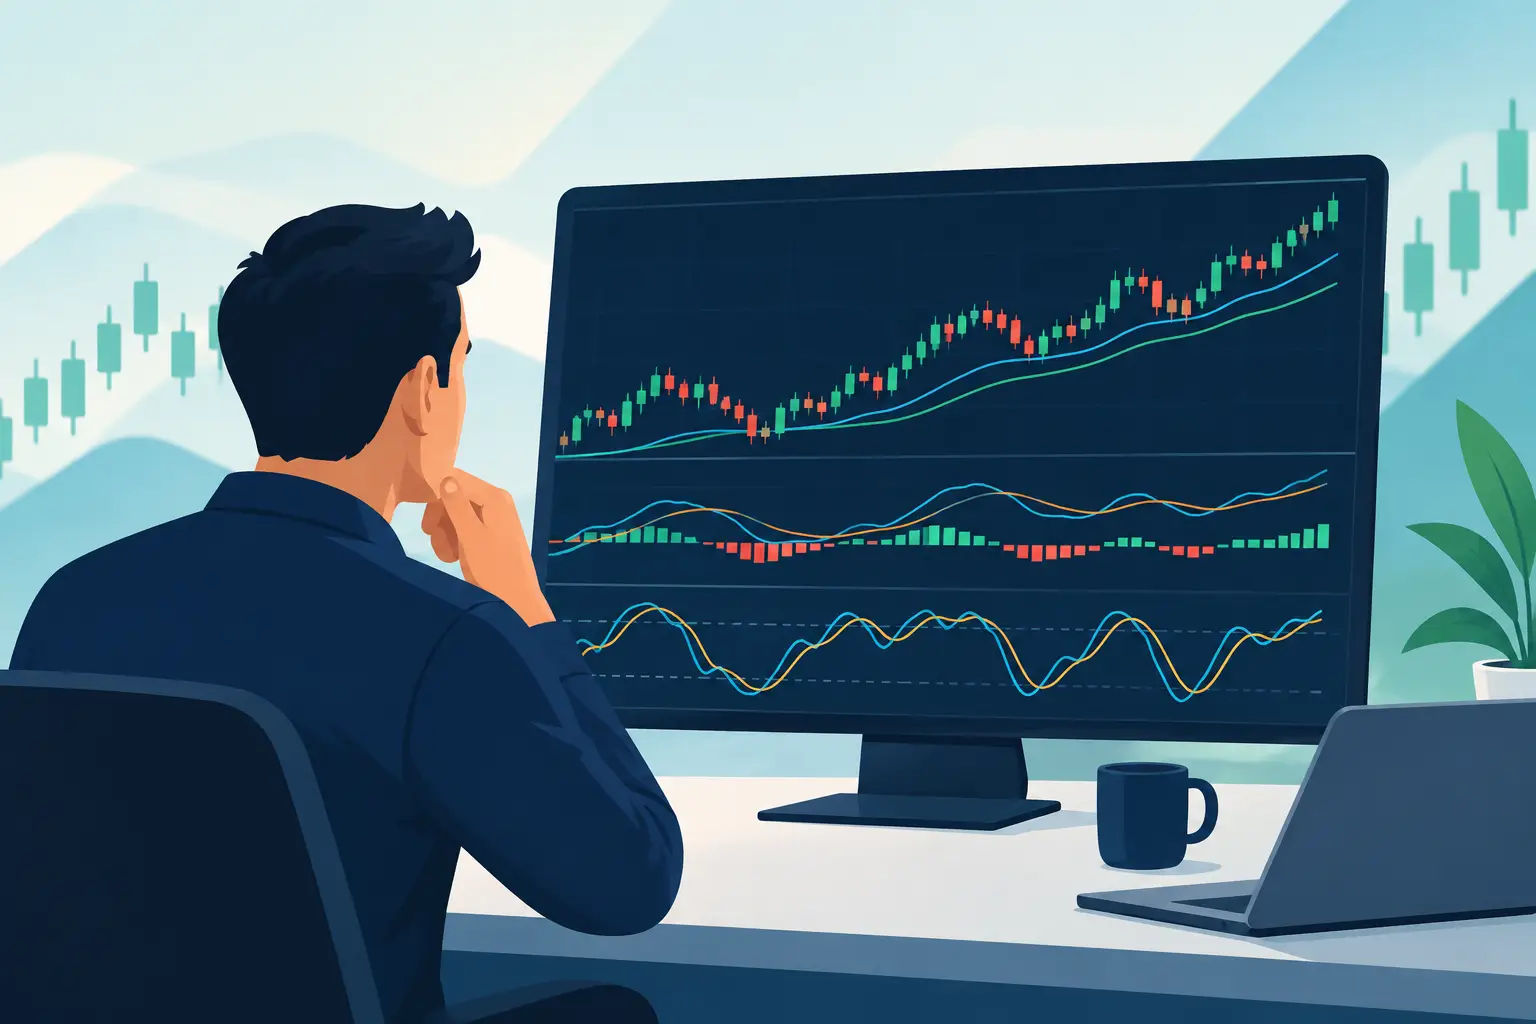
A futures trader indicator setup should make one decision clearer: whether a specific trade meets your rules right now. If the chart creates more debate than conviction, the problem is rarely a lack of indicators. It is usually that each tool has no defined job, or that the trader is asking indicators to predict what only price, volume, and risk management can confirm.
Serious futures traders do not need a screen full of colored signals. They need a structured way to identify market conditions, define trade location, confirm participation, and manage risk. The setup should reduce discretionary noise without hiding the information required to make a professional decision.
Start With the Job of Each Indicator
An indicator is useful when it answers a specific question in your trade plan. Before adding anything to a chart, define the question first.
A trend or structure tool can answer whether the market is moving directionally or rotating. A volume-based tool can show whether participation supports a move. A volatility measure can help determine whether your stop and target are realistic for current conditions. Market internals can provide broader context for index futures when the contract is moving with or against underlying participation.
Problems begin when five indicators are all trying to answer the same question. If three moving averages, a momentum oscillator, and a trend cloud all tell you the market is bullish, you have not created confirmation. You have repeated one input in different visual forms.
A cleaner approach is to build around three layers: market context, trade trigger, and trade management. Context tells you what type of day or session you are trading. The trigger tells you when to act. Management determines position size, stop placement, target logic, and when the premise is invalid.
Build the Futures Trader Indicator Setup in Layers
Your primary chart should remain readable at a glance. Price action, key session levels, and volume should be visible without fighting through overlays. From there, organize indicators by function rather than by popularity.
Layer One: Define Market Context
Context determines which setups deserve attention. A breakout strategy performs differently during a balanced, low-volatility session than during a directional expansion. A mean-reversion entry may work well inside a defined range and fail repeatedly once the market begins accepting price beyond that range.
Start by marking prior session highs and lows, the overnight range, major weekly reference points, and any areas where the market previously accepted or rejected price. These are not indicators in the traditional sense, but they are often more valuable than another oscillator because they establish location.
Then use one objective context tool. For example, volatility measures can tell you whether the day is expanding beyond normal movement. Volume profile or volume-at-price analysis can reveal accepted value and thin areas where price may move quickly. For equity index futures, market internals may help determine whether a directional move has broad support or is being carried by a narrow group of stocks.
The goal is not to forecast the entire day. It is to classify the environment. Is this a trend day, a rotational day, a compressed session likely to expand, or a high-volatility session where reduced size is prudent? Your trade rules should change only when the classification changes.
Layer Two: Use a Precise Trigger
The entry trigger should be simple enough to test and specific enough to execute under pressure. It may be a pullback into a defined value area, a break and hold above an opening range, a reclaim of VWAP with confirming volume, or a reversal from an exhaustion level.
Whatever you choose, define the evidence required before entry. “Looks strong” is not a rule. “Price closes above the opening range, holds on the next pullback, and volume remains above the session average” is closer to a rule that can be measured.
Momentum indicators can be useful here, but only if they are tied to market location. An oversold reading at the middle of a wide range is often meaningless. An oversold reading after a controlled pullback into a prior breakout level may support a long setup. The difference is not the indicator reading. It is the context around it.
For many active traders, a trigger based on price structure plus volume confirmation will produce cleaner decisions than an indicator crossover alone. Crossovers are inherently delayed. That does not make them useless, but it means they should be evaluated as confirmation tools, not automatic entry commands.
Layer Three: Make Risk Visible Before Entry
A valid signal without a defined risk point is not a complete setup. Futures leverage can turn a small planning error into a material loss quickly, particularly in fast contracts such as NQ, CL, or smaller-cap index futures.
Your chart should show where the trade idea is wrong before you enter. This can be a structural level, a session low or high, a value boundary, or a volatility-adjusted distance. The proper stop is not the smallest stop possible. It is the stop that gives the trade room to work while keeping the dollar risk within plan.
Targets should be equally objective. A nearby prior high, a volume node, a measured range projection, or the opposite side of value can all be valid references. The choice depends on your strategy and the day type. On a rotational session, taking profits into opposing value may be sensible. On a strong trend session, rigidly taking the first target can leave substantial opportunity on the table.
This is where rules-based systems outperform emotional management. Decide in advance whether you will scale out, trail behind structure, move to breakeven, or hold to a fixed target. Then collect enough trades to evaluate the rule. Do not rewrite it after one winner or one loss.
Match Timeframes to the Decision
A common failure in futures trading is using a fast chart for every decision. A one-minute chart can refine an entry, but it can also magnify noise and tempt traders into reacting to every bar.
Use a higher timeframe to establish directional and structural context, an execution timeframe to identify the trigger, and, if needed, a lower timeframe only to improve entry precision. For example, a trader may identify value and market structure on a 15-minute chart, wait for a setup on a five-minute chart, and use a one-minute chart to control entry risk.
The timeframes themselves matter less than their roles. If your higher timeframe says price is rotating inside value while your lower timeframe shows a brief breakout, the lower timeframe signal should not automatically override the larger structure. It may be a scalp opportunity, but it should not be treated as a full-session trend signal without supporting evidence.
Avoid Indicator Overload and Hidden Correlation
More data does not automatically produce better trades. Many indicators are derived from the same underlying price inputs, so stacking them can create false confidence. A moving average, MACD, and RSI may appear to offer three independent confirmations, yet all are heavily influenced by recent price movement.
Keep the chart focused. A practical setup may include price and key levels, one volume or participation tool, one context measure, and a clearly defined trigger. Add a tool only when it improves a documented decision.
Ask a direct question before keeping any indicator: Does this change my entry, stop, target, size, or decision to stand aside? If the answer is no, remove it for two weeks and compare your execution. A chart that feels less sophisticated may produce more consistent results because it leaves fewer excuses for hesitation.
Test the Setup Across Conditions
No futures trader indicator setup works equally well in every contract, session, or volatility regime. ES behavior around cash-session liquidity differs from crude oil during inventory releases. A setup that performs well during the New York morning may deteriorate during midday compression. The edge is often conditional.
Track trades by instrument, session window, market condition, setup type, entry location, and outcome. Over time, this shows where the indicator package provides genuine value. You may find that a volume confirmation is highly useful on breakouts but adds little to pullback trades. You may find that a volatility filter protects you from the worst conditions but also causes missed opportunities. That trade-off is normal. The goal is positive expectancy with risk you can execute consistently, not perfect participation.
If you need a cleaner environment to organize charts, rules, and real-time analysis, try the free TickSurfers charting platform. Use it to build a workspace where every tool has a defined purpose and every trade can be reviewed against the same process.
The best setup is not the one with the most signals. It is the one you can explain before the trade, execute during the trade, and evaluate honestly after the session closes.