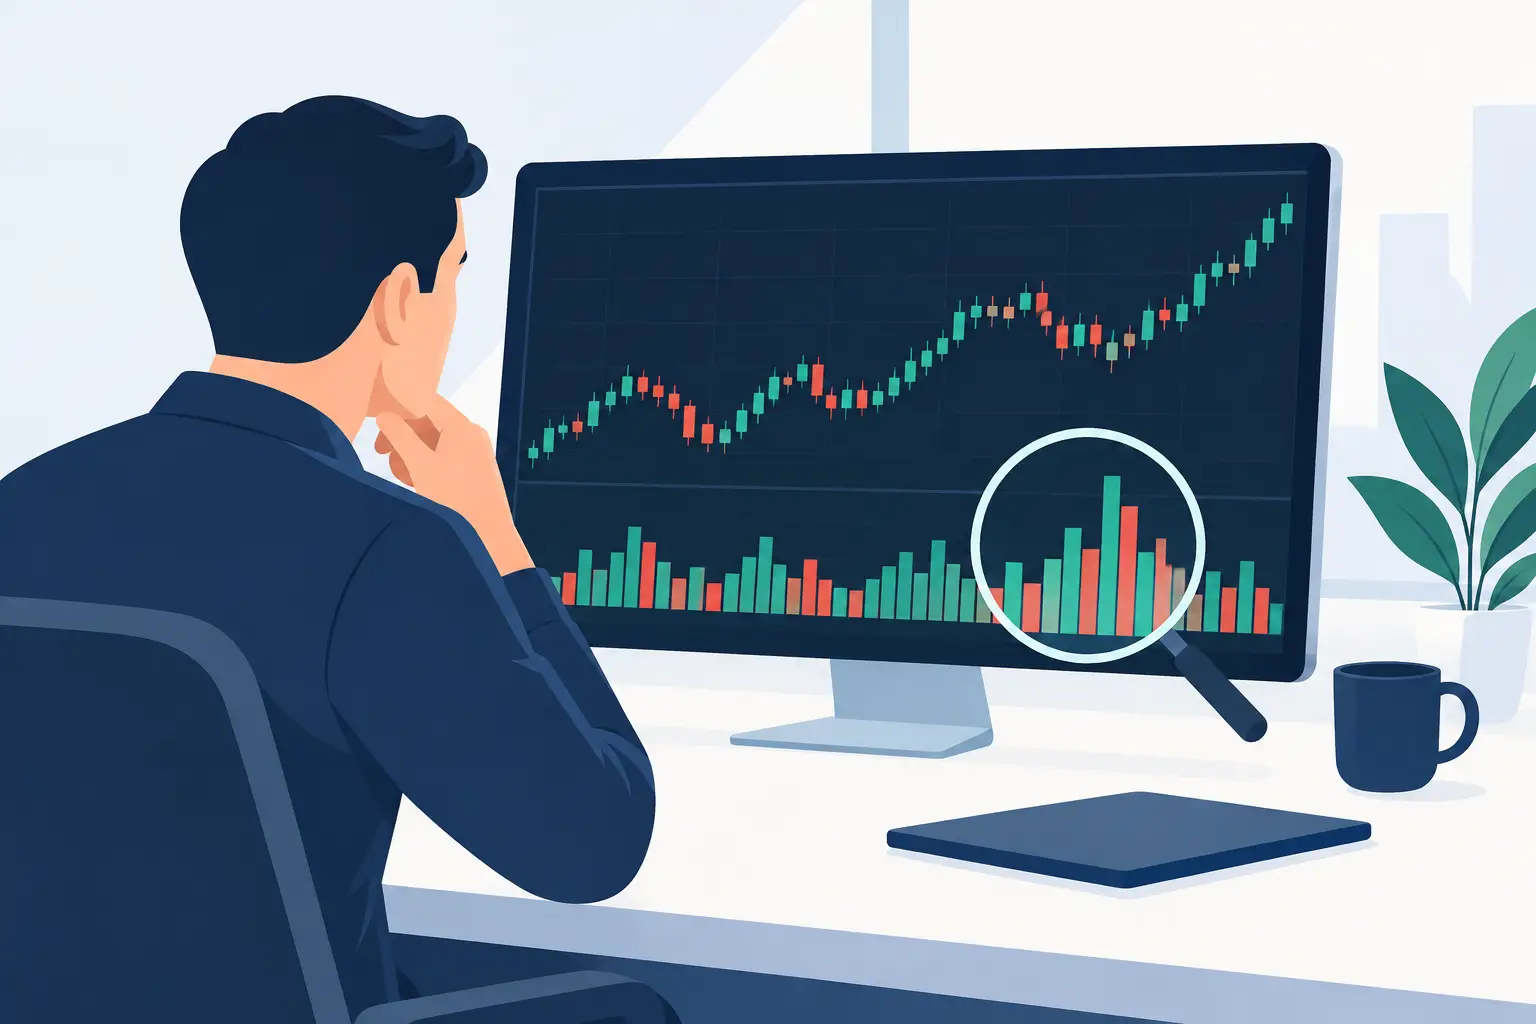
A futures contract can appear to be moving while participation is thin, uneven, or concentrated at a price level that changes the trade entirely. Knowing how to scan futures volume helps you separate active, tradeable markets from noise. The goal is not to chase the contract with the biggest raw number. It is to identify where meaningful participation supports a rules-based setup.
For serious traders, volume scanning should be a pre-trade process. It helps determine which markets deserve attention, when activity is sufficient for your strategy, and whether price movement has the participation needed to carry through a key level.
What Futures Volume Actually Tells You
Volume is the number of contracts traded during a defined period. In futures, it offers a direct view of transaction activity in a centralized marketplace. That makes it especially useful compared with decentralized markets where reported volume can be incomplete or fragmented.
But volume alone is not directional. A high-volume bar can reflect aggressive buying, aggressive selling, liquidation, hedging, or two large participants transferring risk. Price location and response provide the context. When volume expands as price breaks above a well-defined range and holds above it, the market is communicating something different than when volume expands into resistance and immediately rejects.
The practical question is not, “Is volume high?” Ask, “Is volume meaningfully different from normal for this contract, this session, and this location?” That distinction prevents a common error: treating expected opening activity in the E-mini S&P 500 as a major signal while overlooking unusual participation in a quieter commodity contract.
How to Scan Futures Volume With Useful Filters
A useful scanner starts by narrowing the universe. You do not need to monitor every listed contract. Build a focused watchlist around markets you understand, have sufficient liquidity for your position size, and fit your trading hours. Index futures, energy, metals, Treasury futures, currencies, and agricultural markets each have different participation patterns.
Start with liquidity, not just activity
High daily volume is valuable because it generally supports tighter spreads and more reliable execution. Yet average daily volume should be viewed alongside bid-ask spread, market depth, and the contract month you are trading. The front-month contract typically carries the bulk of volume, but rollover periods require attention. A chart may look unusually quiet simply because participation is shifting to the next active month.
Set a minimum liquidity standard that reflects your method. A trader taking quick intraday entries needs more consistent depth and turnover than a swing trader placing wider stops. There is no universal threshold. The correct threshold is the one that allows your trade plan to be executed without slippage dominating the expected reward.
Compare current volume with normal volume
Raw volume favors naturally active markets. Relative volume corrects for that bias by comparing current activity with a historical baseline. For example, if crude oil has traded 160% of its typical volume by the same time of day, participation is elevated. If a contract has traded 60% of its normal volume, a breakout may lack the conditions your strategy requires.
Use a consistent comparison window, such as the average volume at the same time of day over the prior 10, 20, or 30 sessions. A full-day average can be misleading because futures volume follows a strong intraday rhythm. The opening period, US cash equity session, scheduled economic releases, and settlement window all produce different expectations.
Relative volume is most useful when it confirms a setup you already recognize. It is less useful as a standalone buy or sell signal.
Scan for volume expansion at decision points
The best volume opportunities tend to appear at prices where traders must make a decision. These include prior day highs and lows, overnight range boundaries, weekly levels, value-area edges, major moving averages, and established consolidation ranges.
A scanner can flag contracts making new session highs or lows on above-average volume. From there, inspect the chart. Is the market accepting prices beyond the level, or is it rejecting them? Acceptance often appears as sustained trade and closes beyond the level. Rejection often appears as a volume surge followed by a fast return into the prior range.
This is where volume becomes actionable. A high-volume break from balance may support a continuation setup. A high-volume failure outside balance may support a reversal setup. The trade direction depends on the price response, not the volume spike alone.
Use volume profile to locate meaningful prices
Time-based bars show when activity occurred. Volume profile shows where activity occurred. It organizes traded volume by price, helping identify high-volume nodes, low-volume areas, and the price zone where the most business was conducted.
High-volume nodes often act as areas of acceptance. Price may rotate around them because they represent established agreement between buyers and sellers. Low-volume areas can behave differently. If price moves through a low-volume area with momentum, it may travel quickly until it reaches the next area of substantial prior trade.
For scanning purposes, prioritize contracts approaching these reference points with expanding relative volume. That combination is more informative than scanning for volume spikes in the middle of an unstructured range.
Build a Repeatable Daily Volume Scan
A professional scan should take minutes, not consume the entire trading session. The objective is to create a ranked list of markets where activity and location align with your playbook.
Before the main session, review your selected futures markets and mark prior session highs, lows, settlement, overnight extremes, and prominent volume-profile levels. Note scheduled events that can alter participation, including employment data, inflation releases, central bank decisions, inventory reports, and contract-specific reports such as crop updates.
As the session develops, rank markets using three questions. Is current volume above or below its normal pace? Is price trading at a pre-defined decision point? Is price accepting or rejecting that area? A contract meeting all three conditions deserves attention. A contract with elevated volume but no structural location may be active, but not necessarily actionable.
Your final filter is your trade model. A breakout trader may require relative volume above a defined threshold, a close beyond the range, and no immediate return inside. A mean-reversion trader may require a failed breakout, high volume at an extreme, and confirmation back into the prior value area. The scanner finds candidates. Your rules determine whether there is a trade.
Avoid the Volume Mistakes That Damage Execution
First, do not compare volume across unrelated contracts as if every market trades the same way. A volume number that is insignificant in equity index futures may be highly unusual in a thinner agricultural market. Normalize activity within each instrument.
Second, do not ignore the clock. A volume increase during a scheduled release may be expected rather than informative. What matters is how price behaves after the first burst of reaction. Does the market establish acceptance, or does it reverse once initial orders clear?
Third, distinguish volume from open interest. Volume measures contracts traded during a period. Open interest measures outstanding contracts that remain open. Rising open interest can add useful context for multi-day participation, but it is not an intraday confirmation tool in the same way volume is.
Finally, do not let a volume scan become a substitute for risk control. A high-participation market can still reverse sharply. Define your entry, invalidation point, position size, and exit logic before execution. Volume improves signal quality when it is part of a complete process, not when it becomes a reason to abandon one.
Put Volume Analysis Inside a Rules-Based Process
The strongest use of futures volume is as a confirmation layer. Price structure identifies the location. Volume measures participation. Your setup rules define execution. When those elements align, you have a more objective basis for a high-probability trade than a chart pattern viewed in isolation.
TickSurfers traders can use the free charting platform to organize volume, price structure, and market context in one workflow before committing capital. Keep the process simple enough to repeat: scan the same markets, measure activity against the same baseline, and trade only the conditions your data supports.
A disciplined volume scan will not predict every move. It will, however, help you spend your attention where participation is real and where your edge has the best chance to perform.