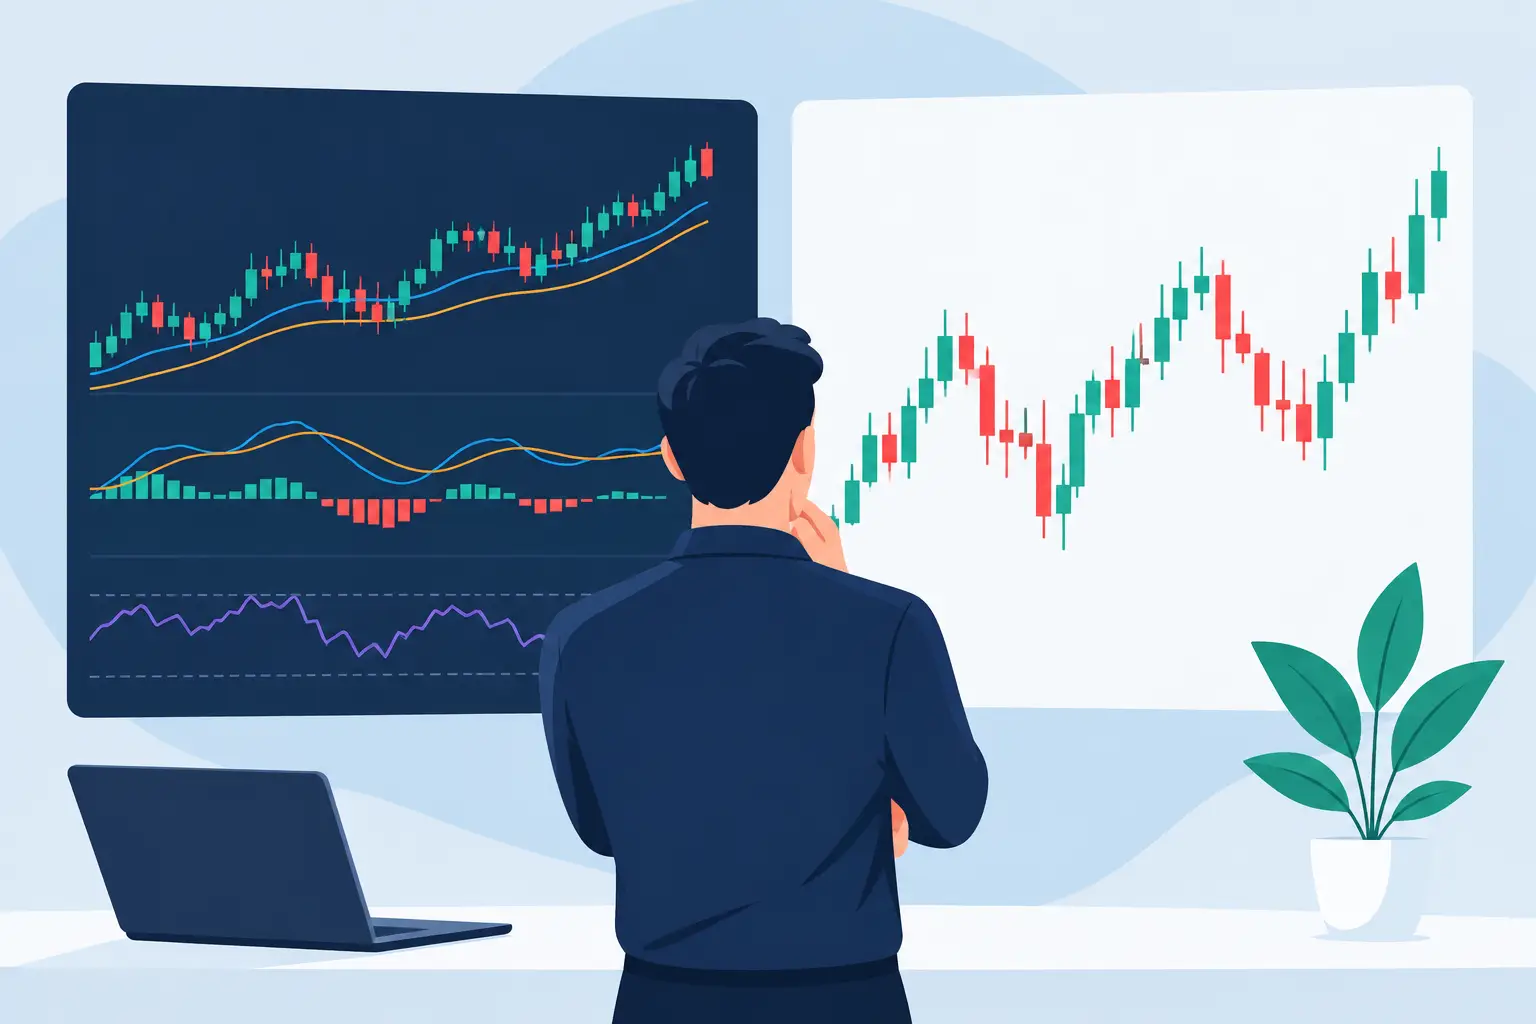
A futures trader watches price press through a prior session high, then pulls back sharply. Price action alone can make the move look like a failed breakout. A volume, breadth, or volatility signal may show whether participation actually weakened or whether the pullback is normal rotation before continuation. That is the real question in indicator signals vs price action: not which camp is right, but which information improves the quality of a decision.
Serious traders do not need more opinions on a chart. They need a process that identifies conditions, defines risk, and produces repeatable actions. Price is the final record of every transaction. Indicators are structured calculations designed to extract information from price, volume, time, or related market data. Used correctly, neither replaces the other.
Indicator Signals vs Price Action: The Core Difference
Price action is the direct study of market movement. Traders read swing highs and lows, support and resistance, range boundaries, breakouts, failed auctions, candle behavior, and the speed of a move. It is immediate, instrument-specific, and essential for execution. Your entry, stop placement, and target ultimately have to make sense on the chart where you are trading.
Indicator signals transform raw data into a defined measurement. A moving average can describe trend direction. ATR can quantify current volatility. Relative volume can compare present activity with a normal baseline. Market internals can show whether broad participation supports an index move. A rules-based signal can combine multiple conditions and alert the trader only when they align.
The difference matters because price action is information, while an indicator is a framework for organizing information. Price action tells you what happened. A well-designed indicator can help answer whether the event is meaningful relative to trend, volatility, participation, or historical behavior.
That distinction also explains why both approaches are often misused. A discretionary trader may see a bullish pattern in every pullback because the pattern has no objective definition. An indicator-driven trader may take every alert without understanding whether price is trending, balanced, extended, or approaching a major level. Both errors come from treating one input as a complete trading system.
Why Price Action Alone Can Fall Short
Price action is indispensable, but it is not automatically objective. Two experienced traders can look at the same five-minute chart and draw different levels, classify a different swing point as important, or disagree about whether a breakout held. The chart is visible to both. The rules used to interpret it are not.
That subjectivity becomes costly when markets accelerate. During a volatile opening drive, price may produce wide bars and apparent reversals that are simply normal noise for the session. In a low-volatility environment, the same bar size may signal a meaningful shift. Without a measurement of volatility or participation, traders often apply the same visual standard to very different conditions.
Price action also has limited context when viewed in isolation. An S&P 500 futures breakout may look clean, but weak breadth or declining volume can reduce the probability of sustained follow-through. A stock may reclaim a key level, yet the move may occur on below-average volume after an extended run. Price remains the execution trigger, but context determines how aggressively the trade should be sized and managed.
Where Indicators Add Professional Value
An indicator earns its place only when it performs a specific job better than an unstructured visual judgment. It should reduce ambiguity, not decorate the chart.
Trend tools can keep traders aligned with the dominant auction rather than repeatedly fading strength because price appears "too high." Volatility tools can adjust stop distance and profit expectations to current market conditions. Volume analysis can distinguish a breakout with meaningful participation from one that lacks commitment. Market internals and breadth data can help index and futures traders determine whether a move has broad sponsorship.
The critical advantage is testability. If a signal has precise conditions, a trader can review it across instruments, sessions, and market regimes. They can measure win rate, average excursion, drawdown, time in trade, and the impact of different exits. That does not guarantee future profits, but it moves the conversation from intuition to evidence.
Indicators also protect against selective memory. Traders tend to remember the signal that caught a major trend and overlook the ten signals taken in poor conditions. A rules-based workflow records every qualified setup. That record is where real improvement begins.
The Trade-Off: Indicators Can Lag and Overfit
The case for indicators is not a case for blind automation. Most indicators are derived from data that has already occurred. A moving average cannot predict the next order flow event. Oscillators can remain overbought or oversold while a strong trend continues. Even a high-quality signal can fail when liquidity changes, news hits, or the market shifts from trend to balance.
There is also a danger in optimization. A strategy with ten filters and highly specific settings may look impressive in a historical test but fail in live conditions because it was fitted to past noise. More inputs do not necessarily create more edge. They can create more ways to rationalize a trade after the fact.
For this reason, indicators should be selected for a clear purpose and validated across enough data to reveal how they behave in different environments. A trader who cannot explain what a signal measures, when it is expected to work, and when it should be ignored does not have a system. They have a chart dependency.
Build a Combined Decision Framework
For most active traders, the strongest approach is to give price action and indicators different responsibilities. Price action defines location and execution. Indicators define conditions and confirmation.
Start with market structure. Is the instrument trending, balancing, breaking from a range, or reversing after a failed move? Mark the levels that matter: prior day high and low, session range, major swing points, volume areas, or other levels relevant to your strategy. This establishes where a trade has logical invalidation.
Next, apply only the indicator data that informs your setup. A trend trader might require alignment with a trend filter and expansion in volume before taking a pullback continuation. A mean-reversion trader might require a measurable extension from value, compressed participation, and evidence that momentum is failing. A futures trader may use internals to confirm whether an index move has broad support.
Then define the actual trigger in price. This could be a reclaim of a level, a break and hold outside a range, a pullback that respects structure, or a failure pattern at an extreme. The indicator should not excuse poor location. If the stop must sit inside normal noise or the target runs directly into resistance, the signal is not enough.
Finally, make risk part of the signal. Position size, stop distance, and trade frequency should adjust to volatility and the quality of confirmation. A setup that meets every condition may deserve normal risk. A setup that is technically valid but occurs late in a move or against weaker participation may deserve reduced size or no trade at all.
Match the Method to the Trading Style
The right balance depends on timeframe and objective. A scalper operating around the open needs fast execution and a tight definition of market conditions. Price action may carry more weight because entry location changes quickly, while volume and volatility tools provide the necessary filter.
A swing trader has more time to use trend, relative strength, seasonality, and volume context. In that setting, indicators can do more of the screening work before price action determines entry. Systems traders may place the greatest emphasis on quantified signals, but they still need price-based rules for fills, stops, slippage assumptions, and abnormal market conditions.
There is no prize for using the fewest indicators or reading the cleanest chart. The standard is whether the process produces high-probability trades that can be executed consistently. If a tool does not change a decision, it probably does not belong in the workflow.
Turn Signals Into a Repeatable Process
A practical review after each session should separate setup quality from trade outcome. A losing trade can be executed correctly if it met the rules and respected risk. A winning trade can be poor if it was entered late, oversized, or taken without confirmation. This distinction is how traders avoid reinforcing bad habits during favorable streaks.
Document the market condition, price location, indicator readings, entry trigger, stop, target, and result. After a meaningful sample, look for the conditions where your signals perform best and where they consistently underperform. You may find that a breakout signal works well only when volatility is expanding, or that a reversal setup needs stronger volume confirmation after the first hour.
If you need a structured environment for that work, try the free TickSurfers charting platform to organize market context, test rules-based signals, and build a process around the data that matters to your trading.
The goal is not to choose between a chart reader's instinct and an indicator's alert. Build rules that let price show where the opportunity exists, then use measured confirmation to decide whether that opportunity deserves capital.