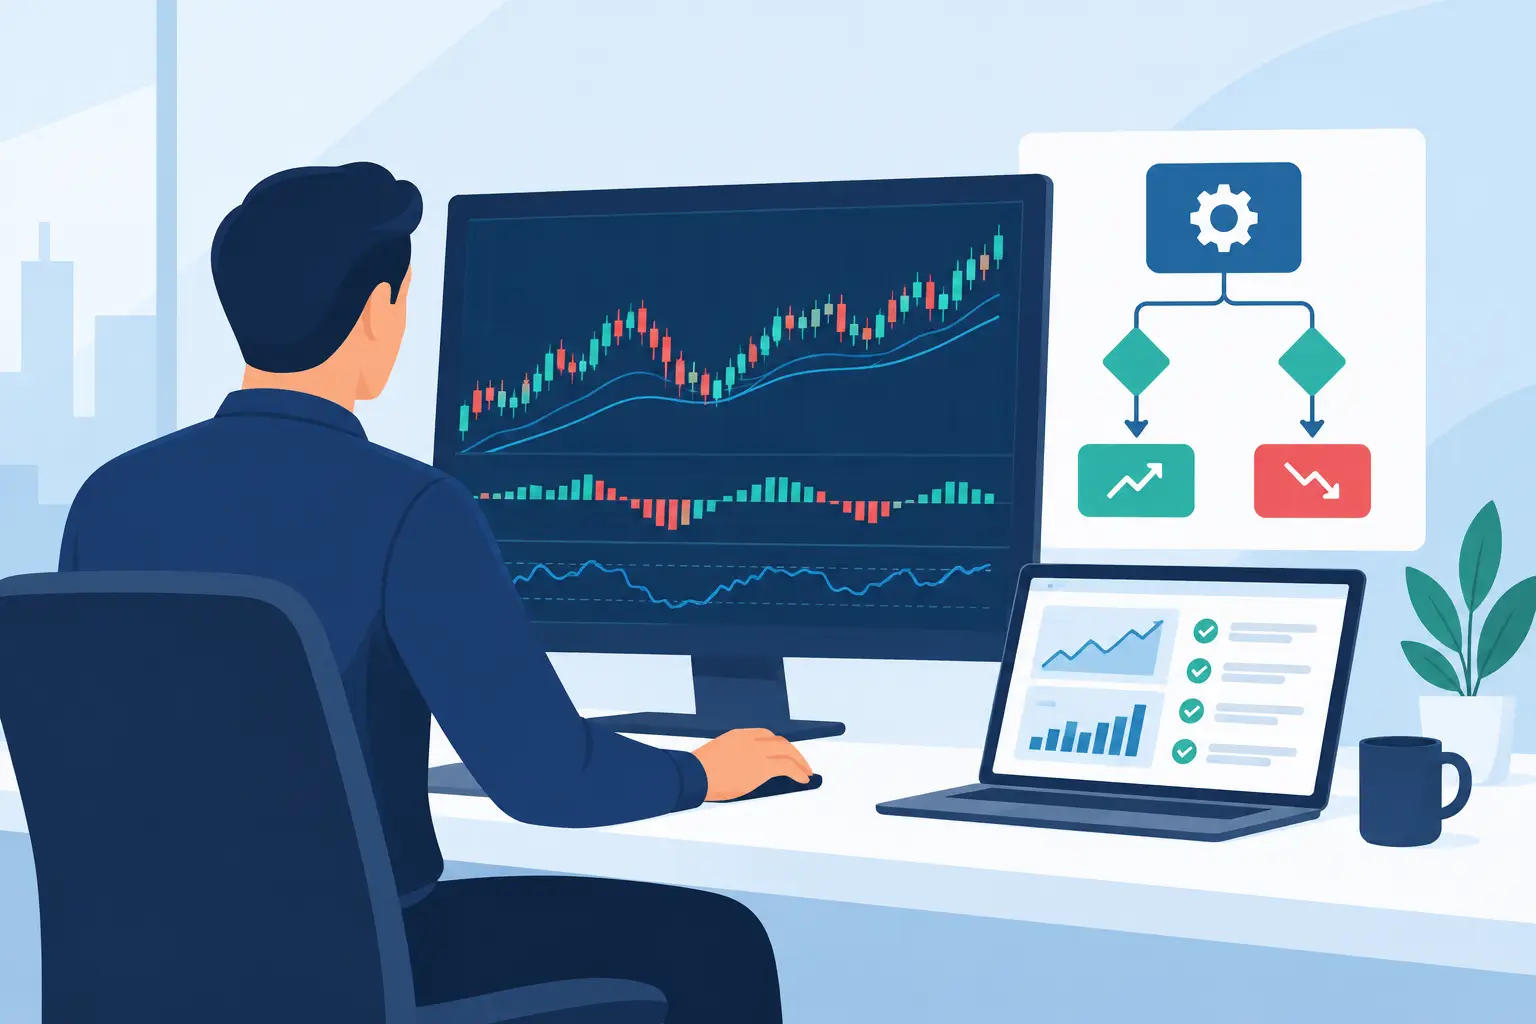
A chart can show where price has been. It does not, by itself, tell you whether participation is expanding, whether volatility supports your setup, or whether the broader market is aligned with your trade. Market analysis software closes that gap by turning raw market data into an organized decision process.
For serious traders, the goal is not to collect more indicators or find a tool that predicts every move. The goal is to define conditions, measure them consistently, and act only when the evidence supports a high-probability trade. The right software helps you spend less time interpreting noise and more time executing a plan.
What Market Analysis Software Should Do
Effective market analysis software should make your trading process more objective. That means it should help you identify market conditions, confirm setups, manage risk, and review whether your rules are producing the results you expect.
Price action remains central, but price is only one dimension of the market. A breakout carries different weight when volume expands. A pullback means something different when breadth remains strong. A volatility contraction may create opportunity, but only if your entry and stop structure account for the likely expansion that follows.
Good analysis tools bring those inputs together without burying the trader under conflicting signals. They should answer practical questions: Is the trend intact? Is participation confirming the move? Is volatility appropriate for this setup? Has the market reached a level where the trade offers favorable reward relative to risk?
The software is not the edge on its own. The edge comes from a defined relationship between market conditions, trade location, entry trigger, risk management, and execution. Software makes that relationship visible and repeatable.
Signal generation must be testable
A signal that cannot be explained cannot be trusted. Whether you trade intraday futures, swing trade stocks, or build systematic strategies, every alert should connect to a clear rule set. You need to know what triggered it, what invalidates it, and how it has performed across different market environments.
This is where many traders lose discipline. They see an indicator flash, enter because the chart looks convincing, then alter the stop or target once the trade is live. A well-designed platform supports the opposite behavior. It makes conditions explicit before the order is placed.
Look for signals that can be filtered by trend, volume, volatility, time of day, market internals, or a higher-timeframe condition. More filters are not automatically better. Excessive filtering can eliminate valid opportunities and produce a system that is too narrow to trade. The right balance depends on your market, holding period, and frequency of opportunity.
Context matters as much as the setup
The same pattern can perform differently in a quiet range, a broad risk-on trend, and a high-volatility liquidation phase. Market analysis software should help you recognize that context instead of treating every chart pattern as identical.
For equity index traders, breadth and market internals can show whether buying or selling pressure is broad-based. For futures traders, volume behavior and session structure may matter more. Commodity, FOREX, and crypto traders may place greater emphasis on volatility regimes, correlations, and the behavior around key levels. The tools should fit the market rather than force every instrument into one template.
Seasonality can also be useful context, particularly for swing traders and position traders. It is not a reason to enter a trade by itself. Historical tendencies can shift when macro conditions, positioning, or liquidity change. Used correctly, seasonality helps frame expectations and prioritize trades that already meet your technical and risk criteria.
Build a Decision Process, Not a Screen Full of Indicators
The common failure with trading software is not lack of features. It is lack of hierarchy. When a trader uses five oscillators, three moving averages, multiple alerts, and a news feed without defined priorities, conflicting inputs create hesitation. Hesitation then becomes late entries, missed exits, and reactive risk management.
Start with the few decisions your process must make. First, determine direction or market state. Second, identify the setup. Third, define the entry trigger. Fourth, set invalidation and trade management rules. Each tool should have one job within that sequence.
For example, a trend tool may determine whether long setups are permitted. A volume or market-internals tool may confirm participation. A price-based trigger can define the actual entry. Volatility measures can determine stop distance and position size. This structure prevents one indicator from being asked to do everything.
A useful workflow also separates analysis from execution. Complete most of the decision-making before the market reaches your trigger. Mark levels, define alert conditions, calculate risk, and decide what would make you stand aside. When price reaches the area of interest, you should be verifying your rules, not inventing them in real time.
Automation should enforce discipline
Automated alerts, strategy rules, and order support can improve consistency, but automation is not a substitute for understanding the method. A system that is automated poorly simply executes poor decisions faster.
Use automation where it reduces avoidable error: monitoring predefined conditions, calculating position size, alerting at key levels, or applying repeatable entry and exit logic. Keep human judgment where the market requires it, particularly when liquidity changes, scheduled events alter conditions, or an instrument behaves outside its normal range.
The right level of automation depends on the trader. A discretionary day trader may use alerts and rule-based confirmation while maintaining manual execution. A systems trader may require full backtesting and automated deployment. Both approaches can be disciplined if the rules are clear and performance is measured honestly.
How to Evaluate Market Analysis Software
Before choosing a platform, begin with your trading plan rather than a feature list. A platform can have extensive capabilities and still be a poor fit if it does not support your markets, timeframes, or preferred decision process.
Assess data quality and relevance first. Intraday traders need timely data and tools that remain usable during fast conditions. Swing traders may prioritize multi-timeframe charting, scanning, and historical research. If you trade several asset classes, consider whether the platform presents those markets in a consistent workflow without sacrificing the specialized data each market requires.
Next, evaluate customization. You should be able to organize charts, apply rule-based indicators, build alerts, and save templates that reflect your process. Customization has a limit, however. If every chart requires constant adjustment, the platform may be adding friction rather than reducing it.
Testing capability is equally important. Historical testing will not guarantee future results, and backtests can be distorted by overfitting, unrealistic fills, and ignored transaction costs. Still, testing is far superior to relying on memory or a handful of recent trades. It lets you ask whether a setup has a measurable tendency, which conditions improve it, and where risk must be controlled.
Finally, consider education and support. Software is more valuable when you understand the reasoning behind the tools and how they fit a complete trading plan. Traders benefit from guidance built by active market participants, not generic explanations detached from live execution.
TickSurfers offers a free charting platform for traders who want to evaluate rules-based tools in a practical workflow. Use a trial period to test whether the charts, signals, and analysis features improve your own process, not simply whether they produce interesting-looking alerts.
Measure the Process After the Trade
Market analysis does not end when a position closes. Your software should support review, because review is where a trading method becomes more precise over time.
Track whether you followed the setup, not only whether the trade made money. A profitable rule violation is still a rule violation. A properly executed loss may be a successful trade if it followed the plan and maintained controlled risk. Separating process quality from short-term outcome is essential for traders who want consistency.
Review performance by setup type, market condition, time of day, direction, and volatility regime. You may find that a signal performs well in trending conditions but poorly during midday consolidation, or that a setup is sound but your execution is late. Those findings are actionable. General frustration is not.
The best market analysis software gives you clearer evidence, but it cannot make difficult decisions for you. Build a process that defines what you trade, when you stand aside, and how much you risk when conditions are favorable. Then let the data hold you accountable to it.