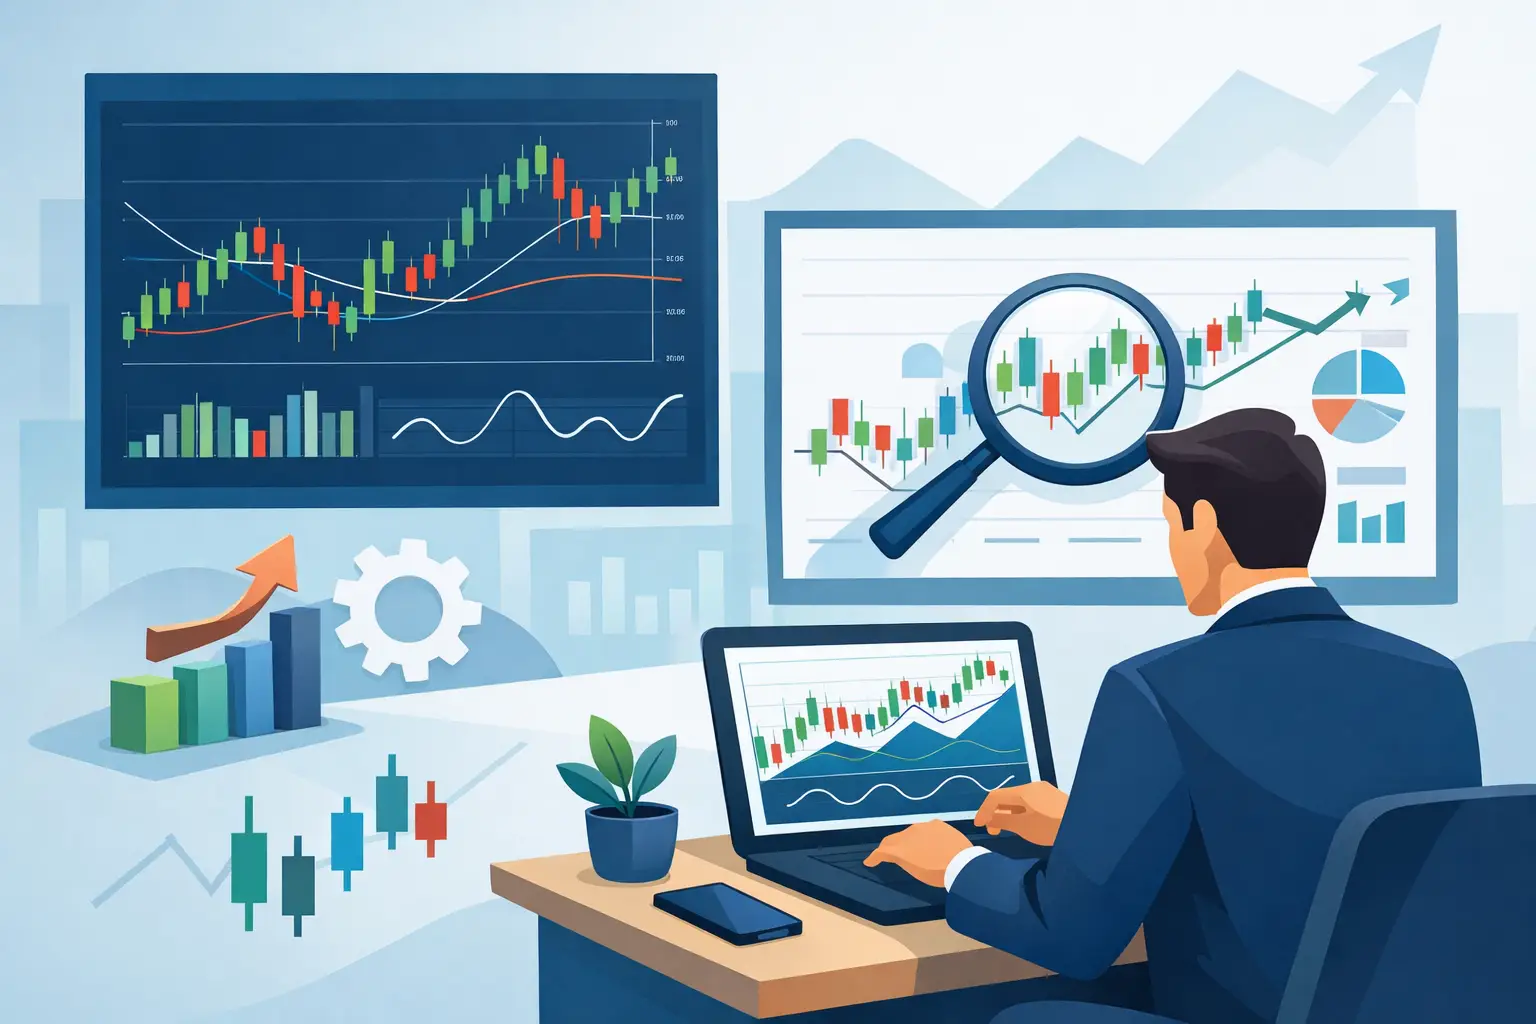
Most trading platforms can plot an RSI, moving average, or volume profile. That is not the standard serious traders should use. A useful trading indicator software review asks a harder question: does the software help you make more objective decisions under real market pressure, or does it add another layer of noise to an already crowded chart?
The difference matters because indicators do not create an edge by existing. Their value comes from the quality of the underlying data, the clarity of their rules, their fit within a trading process, and the trader’s ability to execute consistently. A platform that looks impressive during a demo can become a liability if signals repaint, settings are unclear, or the workflow cannot keep up with fast markets.
What Trading Indicator Software Should Actually Do
Professional-grade indicator software should reduce discretion where discretion is hurting performance. It should help you identify conditions that matter, define trade locations, measure confirmation, and manage risk with rules that can be repeated across a meaningful sample of trades.
That does not mean every tool needs to issue a bright green buy signal or automate every decision. For many active traders, the best software improves context rather than replacing judgment. Market internals can clarify broad participation. Volume analysis can show whether price movement has conviction. Volatility tools can help determine whether a breakout has room to move or is already extended.
The test is straightforward: can you explain what the indicator measures, what market condition it is designed for, and what action it changes in your plan? If the answer is vague, the indicator is probably not improving your process.
Review the Data Before You Review the Signals
A signal is only as credible as the data and calculations behind it. This is especially relevant for futures, intraday equities, Forex, and crypto, where feed quality, session definitions, and exchange coverage can materially change what appears on a chart.
Ask whether the tool uses real-time data, delayed data, tick data, volume data, or a calculation derived only from price bars. None is automatically superior. A swing trader may find end-of-day breadth and seasonality data highly useful, while a futures day trader may require intraday market internals and volume-based confirmation that update without meaningful lag.
Also examine how the platform treats market sessions. A tool that includes overnight futures activity may produce different reference levels than one using regular trading hours only. That can be appropriate, but it needs to be explicit. Serious traders do not want hidden assumptions in the calculations that drive their entries and exits.
Look for stable, explainable calculations
Indicators should be documented in plain language. You should know whether a signal is based on a crossover, a threshold, a multi-factor score, a percentile ranking, or a pattern condition. If a vendor cannot explain the logic without resorting to proprietary mystery language, it becomes difficult to test the tool or trust it when conditions change.
This is not an argument against proprietary research. It is an argument for operational clarity. You need to understand what a signal requires, when it can disappear, and whether it is confirmed only after a bar closes.
The Repainting Question Is Not Optional
Repainting is one of the fastest ways for indicator software to create a false impression of performance. Some indicators revise historical plots as new price data arrives. Others appear stable on closed bars but fluctuate during a live bar. Neither behavior is necessarily deceptive if it is clearly disclosed and correctly used, but both can mislead traders who assume a chart shows signals exactly as they appeared in real time.
During a review, verify whether alerts trigger intrabar or only at bar close. Determine whether historical signals remain fixed after printing. If the platform supports multi-timeframe logic, check how higher-timeframe values are handled before that higher-timeframe bar is complete.
A disciplined workflow uses confirmed information for confirmed decisions. For example, an intrabar alert may be useful for preparation, while a bar-close condition may be required for entry. The software should give you enough control to separate those two decisions.
A Good Indicator Needs a Defined Job
The most common platform mistake is treating every available study as a reason to add another panel. More indicators often produce more confirmation bias, not better analysis.
Review software by the job each tool performs. Trend tools can define directional conditions. Momentum tools can identify acceleration or exhaustion. Volume and market-profile tools can locate participation and acceptance. Market internals can measure broad pressure beneath index price action. Volatility tools can set realistic expectations for range, targets, and stop placement. Seasonality tools can provide a longer-term tendency, not a prediction.
The strongest workflow combines tools that answer different questions. Three momentum oscillators usually tell you the same thing with different formulas. A trend filter, a volume condition, and a market breadth input may offer more useful separation of evidence.
Avoid software built around constant signals
A platform that produces signals all day may feel productive, but active trading is not a contest to find the maximum number of entries. High-probability trades are usually selective. Good software should allow you to filter for specific market environments rather than encourage action in every condition.
This is where rules-based systems have an advantage. Instead of asking, “What does the chart feel like?” you can ask, “Are the conditions for this setup present?” That shift makes it easier to review performance, identify execution errors, and decide whether a setup still deserves capital.
Test the Workflow, Not Just the Indicator
A trading indicator software review should include the complete working environment. Charts, alerts, watchlists, scanning, layout management, data speed, and strategy support all affect whether a tool is usable when the market is moving.
Start by recreating your existing process. Can you build the timeframe structure you use? Can you save templates for different products? Can you receive alerts without staring at the screen? Can you move from a market-wide read to an individual setup quickly enough to act on it?
For systems traders, testing and automation features deserve close attention. Historical testing should allow realistic assumptions for commissions, slippage, trading hours, and order behavior. Results that ignore execution friction can look excellent on paper and fail immediately in live trading. If the platform supports automated strategy logic, confirm that the rules can be expressed precisely and monitored without ambiguity.
Usability is not cosmetic. If a process takes six clicks during a volatile opening range, you may skip it when discipline matters most. Efficient software supports consistent execution because it makes the right action easier to take.
Evaluate Performance Claims With Professional Skepticism
No indicator should be judged by a screenshot of a perfect entry. Markets offer enough historical examples to make almost any tool look exceptional when settings, dates, and instruments are selected after the fact.
Ask for a repeatable framework instead. What are the setup rules? What is the intended holding period? Which market regimes are favorable? When should the tool be avoided? How is risk defined? A credible provider will discuss limitations alongside opportunity.
Then test the tool against your own instruments and timeframe. A mean-reversion signal that performs well in quiet index futures may not translate to a momentum-driven small-cap stock or a weekend crypto market. Use simulated trading or minimum-size positions first, collect a sufficient sample, and track results by setup type and market condition.
The goal is not to find a perfect win rate. The goal is to determine whether the software improves expectancy, reduces avoidable mistakes, or gives you a clearer way to manage risk.
Education and Support Separate Tools From a Trading Process
Indicator software is most valuable when the provider helps traders use it correctly. A tool can be technically sound and still disappoint if users apply it outside its intended context or fail to build rules around it.
Look for education that explains interpretation, setup selection, risk parameters, and review methods. Direct access to experienced traders can also be valuable when it focuses on process rather than trade calls. The right support should make you more independent over time, not more dependent on someone else’s opinion.
TickSurfers’ free charting platform is a practical place to evaluate this kind of workflow. Use it to test whether its charting environment and data-driven tools fit the way you plan, validate, and execute trades before making a larger commitment.
The Standard Worth Holding
The best indicator software will not eliminate losses, predict every turn, or substitute for risk management. It should give you something more durable: a clearer operating process when price is moving quickly and emotion is trying to take control.
Choose software that makes its logic visible, its data credible, and its role in your plan specific. Then demand proof from your own trade journal. The platform worth keeping is the one that helps you follow better rules when it counts.