Expansion Contraction Indicator
Description
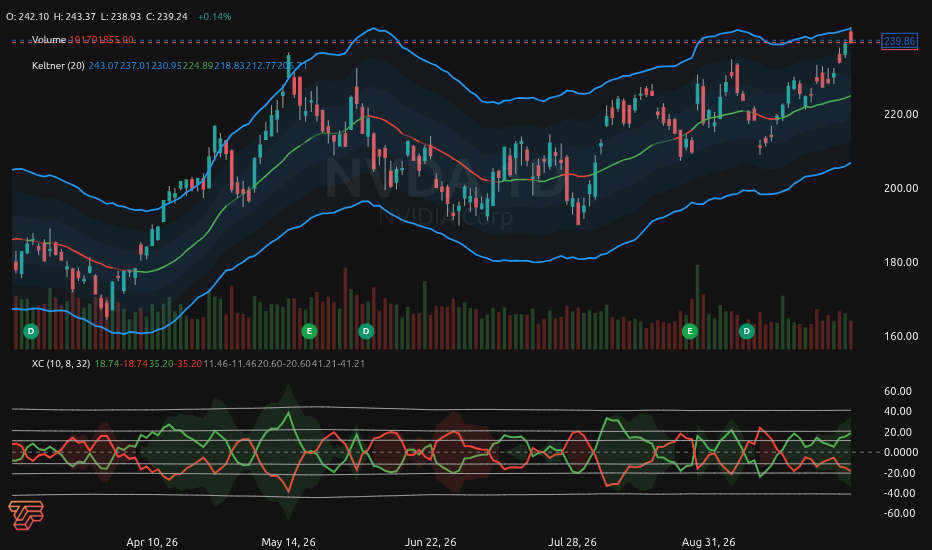
Expansion Contraction measures the speed at which price moves through two moving averages, a 10 period SMA of the high and an 8 period SMA of the low (Moving Average Channel). When the Positive (green) line crosses above the zero line and the cloud is green, we are in a strong uptrend and a buy signal can be taken. When the Negative (red) line crosses above the zero line and the cloud is red, we are in a strong downtrend and a sell signal can be taken.
Standard deviation (gray) lines are added to measure the strength of the trend and support and resistance areas. When the short lines go above 1 or 2 standard deviations, it may indicate price may have gotten very high or very low too quickly in the short term. When the cloud goes above 2 standard deviations, it may indicate the overall trend may be getting ready for a reversal.
Platform
Expansion Contraction Indicator runs natively on the TickSurfers Charting Platform. Create a free account to open the chart and use Expansion Contraction.
Private and shared indicators require a Pro chart subscription.
Expansion Contraction on TickSurfers Chart
This study runs on the charting platform. Create a free account to open the chart.