Benner Cycle
Description
The Benner Cycle was created by Samuel Benner, a successful farmer from Ohio who had an unfortunate turn of events in the market panic of 1873. Thereafter, he set out to find cycles in the markets and published his book in 1884, “Benner’s Prophecies of Ups and Downs in Prices”.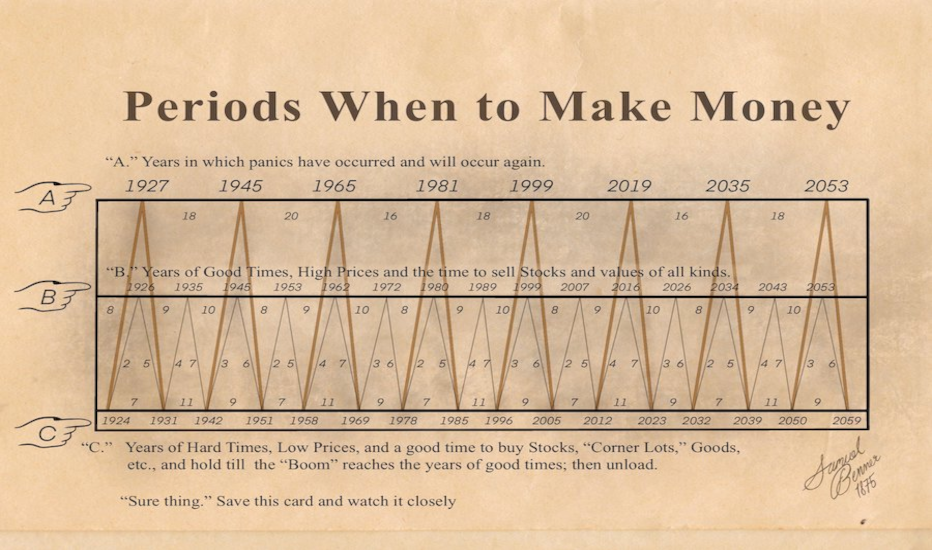
Samuel Benner points out three areas in his chart:
A. Panic Years - Years in which panics have occurred and will occur again.
B. Good Times - Years of Good Times, High Prices and the time to sell Stocks and values of all kinds.
C. Hard Times - Years of Hard Times, Low Prices, and a good time to buy Stocks, “Corner Lots”, Goods, etc., and hold till the “Boom” reaches the years of good times; then unload.
I’ve recreated the cycle formula here. It is best suited for weekly, monthly or 12 month charts on the $SPX, or other symbols that have very long history of price data. My recommendation is to set your chart on the 12-Month timeframe of the $SPX to more clearly see both the past and future cycles.
Platform
Benner Cycle runs natively on the TickSurfers Charting Platform.
Launch the TickSurfers Chart
Private and shared indicators require a Pro chart subscription.